To calculate DunedinPACE in EPIC V2 data, please install or update to the latest version of the DunedinPACE package from Github.
Epigenetic Aging measures in EPIC V1 vs EPIC V2 data
Background
DNA methylation is most commonly assayed using microarrays, most notably those produced by Illumina and known as beadchips. In November 2022, Illumina released its latest version of beadchip, the EPIC V2 array. This version supersedes the previous EPIC (V1) beadchip, which had been available since 2016. Whilst generally speaking subsequent beadchip replacements are built on the content of their predecessor (with additional content added), probe content is not always shared in its’ entirety between the beadchip versions. This holds true of the shift from EPIC V1 to V2 versions since a proportion of V1 content is absent from the V2 beadchip. DunedinPACE was developed using data generated from the EPIC V1 beadchip. The new EPIC V2 array does not contain 29 of the original 173 DunedinPACE probes (~17%); i.e. there are 29 DunedinPACE probes not shared across the EPIC V1 and EPIC V2 arrays.
We previously documented strategies to evaluate the impact of this array change on DunedinPACE calculations and made suggestions for potential strategies going forward. However, these previous evaluations were made using simulated EPIC V2 data (cross-array probe matched data) created from DNA methylation data generated from EPIC V1 beadchips. This report now documents evaluations of epigenetic aging measures (DunedinPACE and others) using measured EPIC V2 data.
Samples and measurements
We selected for EPIC V2 measurement 90 Dunedin DNA samples which had been previously measured using EPIC V1 at age 45. In addition, we selected 6 of these to be measured twice (i.e. 6 duplicates). Samples were selected to represent the entire distribution of DunedinPACE values in Dunedin at age 45; to do this, samples were binned into deciles based on DunedinPACE value, and 9 samples were randomly selected from each quintile (N.B. first and last deciles contained less than 9 individuals; in these cases, we selected additional samples from the deciles above and below). These samples were measured using the Infinium MethylationEPIC v2.0 Kit at Duke Molecular Physiology Institure Core facility in September 2023.
Data processing
Raw iDATs were processed and normalized using three different strategies to enable evaluation of data processing differences on epigenetic aging estimates. These were chosen to reflect common approaches to DNA methylation data processing:
- iDATS were read using the ‘wateRmelon’ R package, tested for outliers and bisulfite conversion rate queried. One sample was unable to be read, and two samples were identified as having bisulfite conversion rates <80% and removed, leaving 93 samples (88 unique DNA samples, plus 5 duplicates). We then removed 1,448 probes with beadcount < 3 in 5 % samples, and 5,491 probes with detection p-value > 0.05 in 1% of samples. We then normalized the data using the ‘normalizeMethyLumiSet’ method in the package ‘methylumi’. This method most closely matches that used to process Dunedin age-45 methylation data, and we call this the ‘methylumi’ dataset going forward.
- We followed the QC procedure above, but this time we normalized data using the ‘dasen’ function in wateRmelon. This method most closely matches that used to process E-Risk age 18 methylation data, and we call this the ‘watermelon’ dataset going forward.
- iDATs were read using the ‘seSAMe’ R package and QC statistics checked. The same 3 poorly performing samples described above were removed from the data. Data were normalized using dye bias correction (DyeBiasNL, D), detection p-value masking using oob (pOOBAH, P) and background subtraction using oob (noob, B). This is one of the approaches recommended by Illumina for EPIC V2 data, and we call this the ‘sesame’ dataset going forward.
Dealing with duplicate probes and probe naming: EPIC V2 beadchips contain some probes that are duplicated multiple times across the array (mostly probes important in cancer biology). Two probes in the DunedinPACE algorithm are duplicated (cg26180383 and cg06230206), and if left uncorrected might lead to potentially incorrect DunedinPACE estimates by ‘doubling up’ the values from these probes. An additional complication is that probe names (IlmnID) have suffixes to cg identifiers reflecting design information. If suffixes are not removed from data in pipelines using IlmnID as probe identifiers, calculations will fail. To deal with these issues we did the following:
- data processed using wateRmelon and methylumi: we used the ‘rm.cgsuffix’ function in the ‘EN.mix’ package (v1.36.08) to remove suffixes and average methylation values from duplicates into one value.
- Data processed using SeSAMe: we used options collapseToPfx = TRUE and collapseMethod = "mean" within the ‘getBetas’ function. This too removes suffixes and averages methylation values from duplicates into one value.
After QC and removal of duplicate probes the datasets contained 917,069 and 930,659 probes in the wateRmelon/methyumi and SeSAMe datasets, respectively.
Section 1. Evaluating DunedinPACE in EPIC V2 data.
Once the data were processed and beta values generated, we moved to calculating DunedinPACE values in EPIC V2 data. For the following investigations, we randomly removed duplicate arrays (i.e. used data from 88 unique samples).
We used the ‘DunedinPACE’ R package to calculate DunedinPACE values in EPIC V2 data. To ensure our data met the messing data threshold for calculation, we set ‘proportionOfProbesRequired = 0.1’. These values are labelled ‘DunedinPACE’
We calculate DunedinPACE in all three differentially processed datasets (methylumi, watermelon and sesame). To evaluate accuracy of these three estimates, we will compare to the DunedinPACE values generated from EPIC V1 data at age 45 (‘original’ DunedinPACE).
Figure 1 shows the intercorrelations (Pearson’s r, r, above the diagonal in the red boxes) between original EPIC V1 DunedinPACE and DunedinPACE in three EPIC V2 datasets. Also shown are intraclass correlations (ICC(2,1)) and 95% confidence intervals (in square brackets). Below the diagonal are scatterplots of the correlation with regression line in red. The white boxes on the diagonal contain mean, median, maximum and minimum values of the listed DunedinPACE estimate.
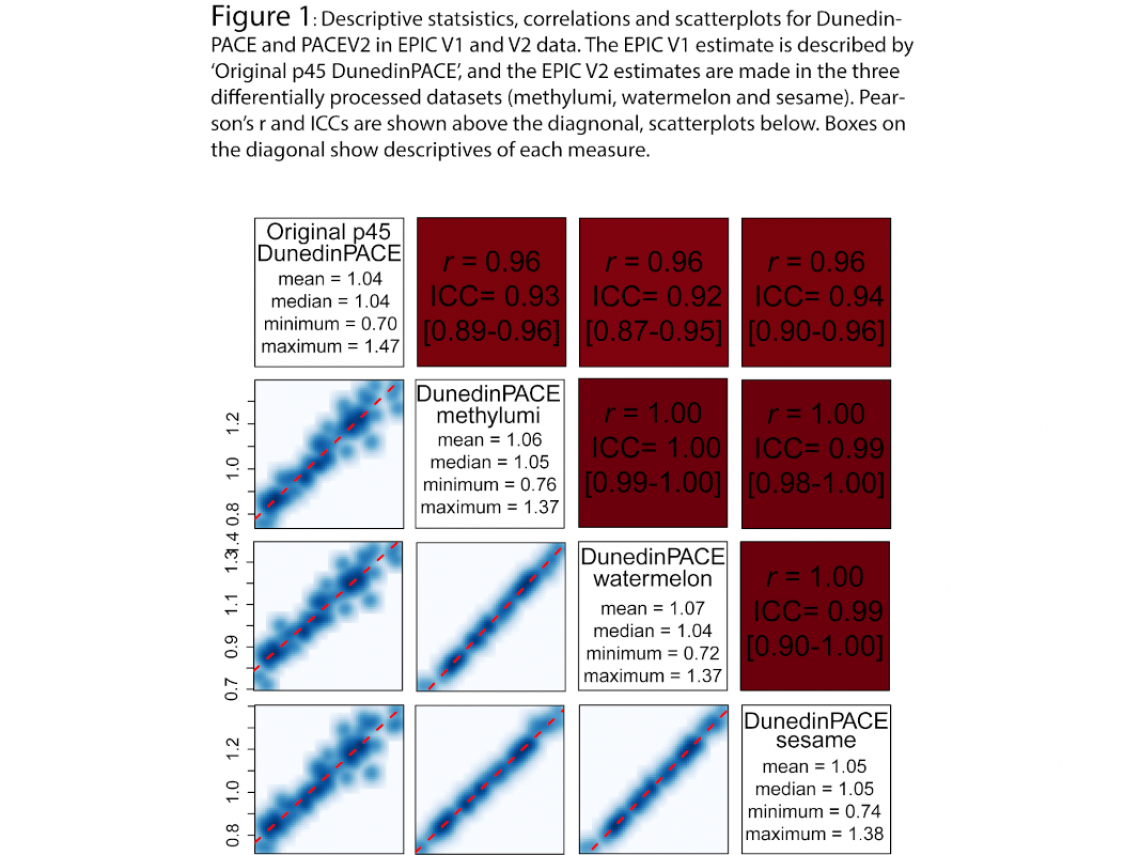
These results suggest three conclusions:
- DunedinPACE calculated in EPIC V2 data is highly correlated with DunedinPACE in EPIC V1 data.
- Data processing pipelines have little effect on calculation of either DunedinPACE as evidenced by high correlations and ICCs across all of the estimates.
- Compared to original DunedinPACE, mean/median DunedinPACE values are similar for DunedinPACE in EPIC V2 data, though range (variance) is reduced.
Figure 2 is a scatterplot of the association between original DunedinPACE and the three estimates of DunedinPACE in EPIC V2 data. Lines represent the regression line for each measure. The green line represents the slope y = x i.e. perfect agreement between DunedinPACE measures.
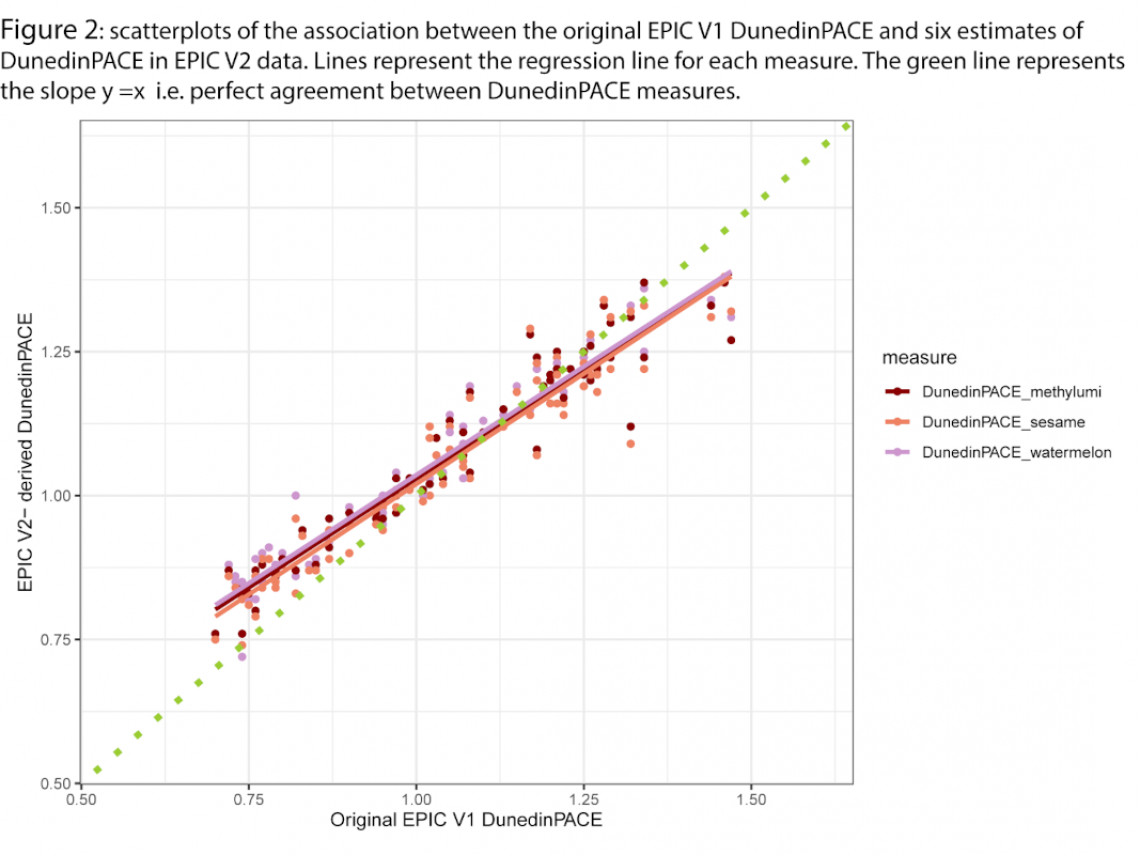
From these plots, the following observations can be made:
- EPIC V2 measures of DunedinPACE are very similar to each other. This could potentially represent the reduction in variation introduced by correction for missing data during calculation (i.e. substitution of mean Dunedin age 45 beta values for missing data that is part of the calculation pipeline). Because these probes are missing across all samples as they are not present on the EPIC V2 array, this substitution reflects simply a constant added to all samples, potentially reducing variation.
- The slope of the association between EPIC V1 and V2 measure is lower than 1. This could again reflect reduced variation due to missing data handling.
Conclusions
These results suggest that DunedinPACE estimates from EPIC V1 data can be reliably replicated in EPIC V2 data. Of some concern might be the reduction in variation arising from the use of the DunedinPACE algorithm.
Recommendations
Because the DunedinPACE algorithm is already established, described in the literature, and heavily used, it is preferable to continue to use this algorithm to estimate DunedinPACE in EPIC V2 data. Going forward, we will implement two amendments to the DunedinPACE code to account for EPIC V2-specific features:
- Reduce the default for the ‘proportionOfProbesRequired’ argument to a lower value. Since there are ~17% missing DunedinPACE probes in EPIC V2 data, this would provide a cushion for users who are skirting the current missing data threshold of 20%
- Add a check that supplied data does not include duplicate probe values, and that probe identifiers have suffixes removed. Removal of suffixes should circumvent return of NA upon calculation of DunedinPACE (and troubleshooting with users), and removal/averaging of duplicate probe values will reduce error in estimates. With the current pipeline, any such error would not be flagged and inaccurate estimates would be returned.
Section 2: Benchmarking DunedinPACE cross-beadchip reliability against other epigenetic aging algorithms
Although we have demonstrated that DunedinPACE estimates can be reliably estimated in EPIC V2 data, there is a small amount of inaccuracy between the two. However, it is not possible to determine whether the magnitude of these small differences is within or beyond the realm of expectations. One way in which we might estimate how well DunedinPACE performs in EPIC V2 data is by comparing cross-beadchip reliability with that of other aging algorithms.
Here, we compare the cross-beadchip reliability against that of four other popular aging clocks: the GrimAge algorithm, PhenoAge algorithm, the Hannum clock, and the Horvath clock. We then compare the association between EPIC V1 and EPIC V2 estimates for each clock against those for DunedinPACE outlined in Section 1.
Epigenetic clock calculations
For this investigation, epigenetic clocks are calculated in the following ways:
- Estimates made using the R package ‘PC-Clocks’. This package estimates measures that are corrected for technical variation. We calculate these measures in both EPIC V1 (age 45 data) and EPIC V2 Dunedin data. These estimates are hypothesized to be more reproducible than those calculated using the original methods (e.g. the online calculator). These clocks are prefaced by ‘PC’
- Estimates made using the R package ‘methyCIPHER’. This package estimates measures of the Horvath clock, the Hannum clock, and the PhenoAge clock uncorrected for any technical variation. We calculate these measures in both EPIC V1 and EPIC V2 data.
In all cases, these values are age estimates and are therefore reported in units of years.
We then went on calculate age advancement values for each of these measures by residualizing each estimate for an individual’s exact age at the age 45 assessment. Although the Dunedin study is not an ideal cohort in which to test age acceleration due to the lack of variation in chronological age, we calculate these values to test whether cross-beadchip reliability in measures differs.
Results
Figure 3 shows an overview of the reproducibility of various aging estimates between EPIC V1 and EPIC V2 data. For this figure, we are only showing estimates made using the EPIC V2 methylumi dataset as it most closely resembles the procedure used to produce the age 45 EPIC V1 data. Descriptive statistics are calculated in the 88 unique samples (EPIC V1 samples matched to available EPIC V2 samples). Panel A shows the descriptive statistics, correlations/ intraclass correlations (ICCs) and scatterplots for the estimates of age (in years) as provided from the algorithms; Panel B shows correlations/ICCs and scatterplots for age advancement measures. The first two rows show values for DunedinPACE (described in section 1), rows 3-10 show values for PC-corrected clock estimates, and rows 11-16 show estimates for uncorrected clocks calculated using methylCIPHER.
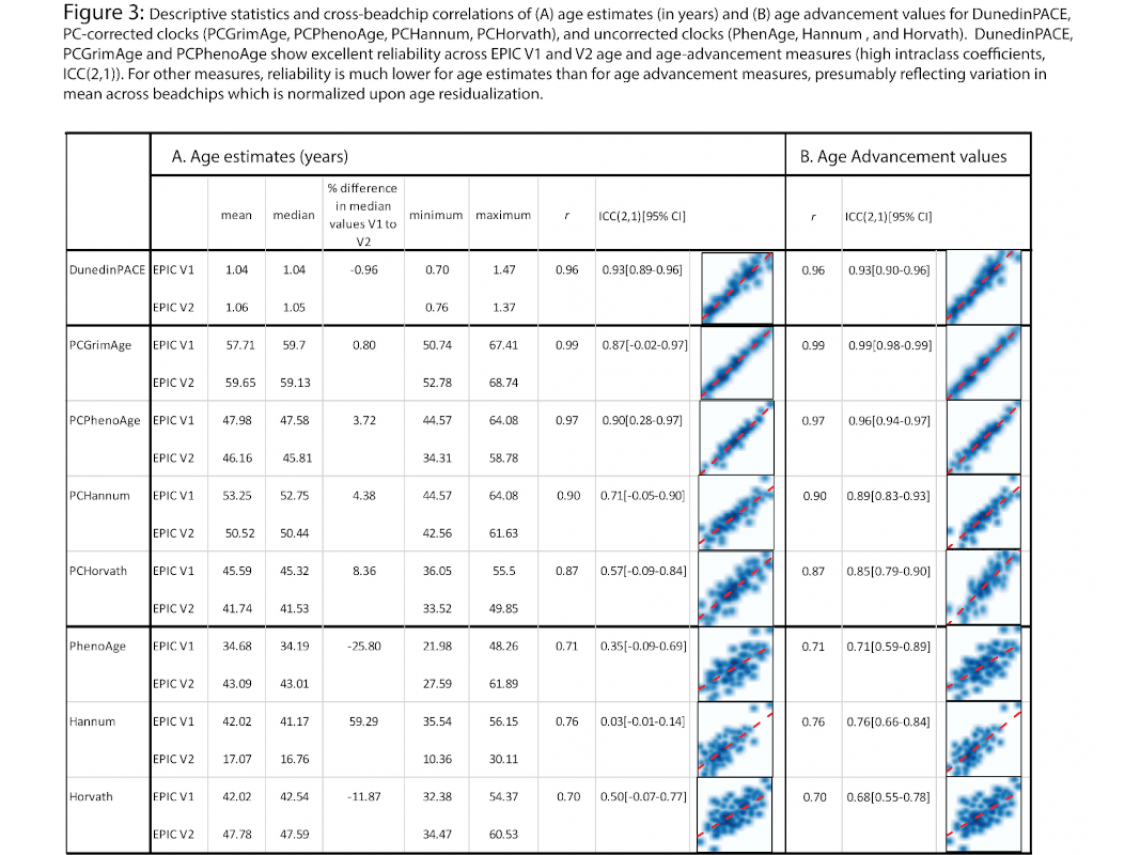
The following observations can be made:
- DunedinPACE, PCGrimAge and PCPhenoAge show excellent cross-beadchip reliability (as measured by ICC), and PC-corrected Hannum and Horvath measures have moderate to high reliability.
- Uncorrected epigenetic age estimates (PhenoAge, Hannum, Horvath, rows 11-16) have very poor cross-beadchip reliability (ICC= 0.03 for Hannum to 0.50 for Horvath). Mean/median shifts between EPIC V1 and EPIC V2 values for these estimates are moderately large (e.g. median Hannum value in V1 data = 41.17, median value in EPIC V2 = 16.76; difference in median values between EPIC V1 and V2 estimates = 59.29%). No estimate of uncorrected GrimAge is available.
- DunedinPACE ICC is very similar for unresidualized and age-residualized estimates, while for other all other measures ICCs are improved by age-residualization. This likely reflects mean level differences in the unresidualized estimates observed for the other clocks undergoing normalization upon age residualization.
Because the uncorrected clock estimates show poor correlation between beadchip types, we decided to investigate the amount of missingness in the probes that make up the algorithms (N.B. the list of GrimAge probes is not available so is not included).
Figure 4 shows venn diagrams representing the number (percent) of missing probes in EPIC V1 and V2 data for DunedinPACE, PhenoAge, Hannum and Horvath algorithms. Interestingly, there is little overlap between missing probes on EPIC V1 and V2 beadchips for Hannum and Horvath clocks, suggesting probes that were missing on EPIC V1 beadchips were re-introduced during the design of EPIC V2 chips.

Effect of processing strategy on estimates of epigenetic clocks
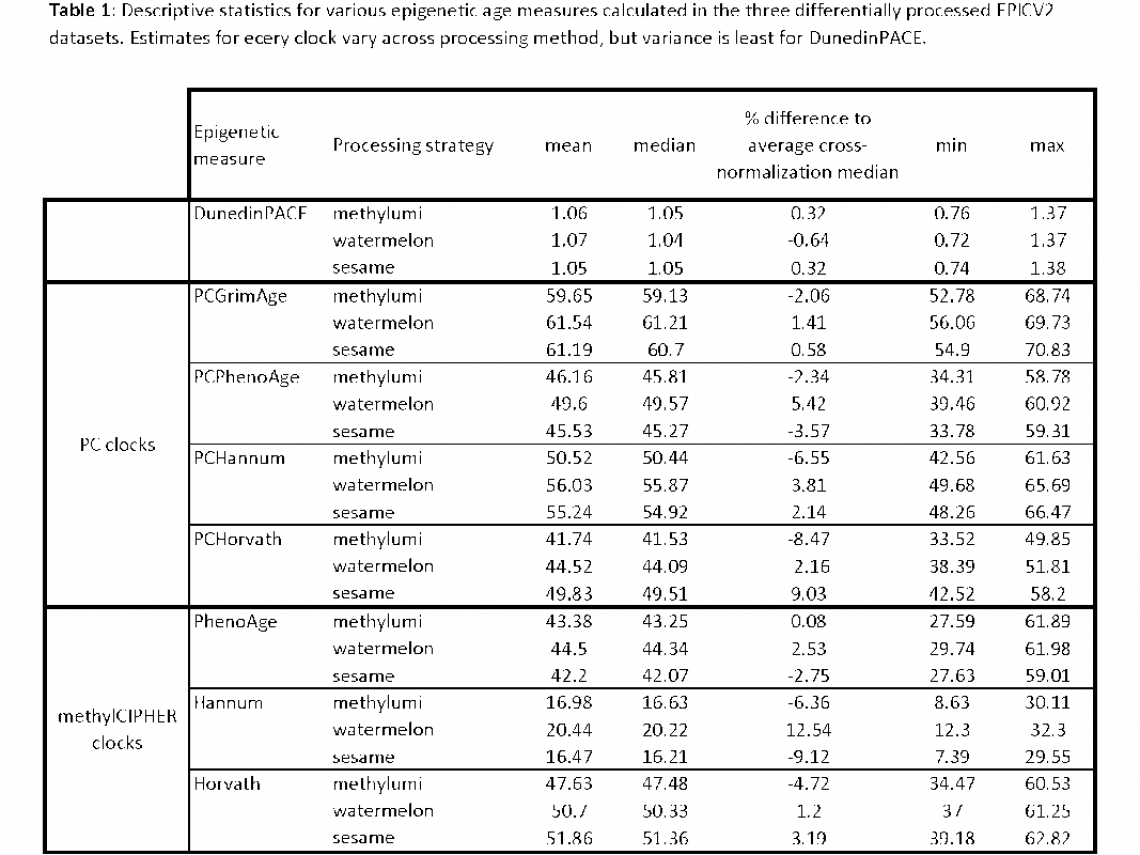
Although we have shown that data processing pipeline has little effect on estimates of DunedinPACE, we aimed to test whether that was true of other epigenetic aging estimates. We therefore calculated the EPIC V2 estimates in the three differentially processed datasets (methylumi, watermelon and sesame).
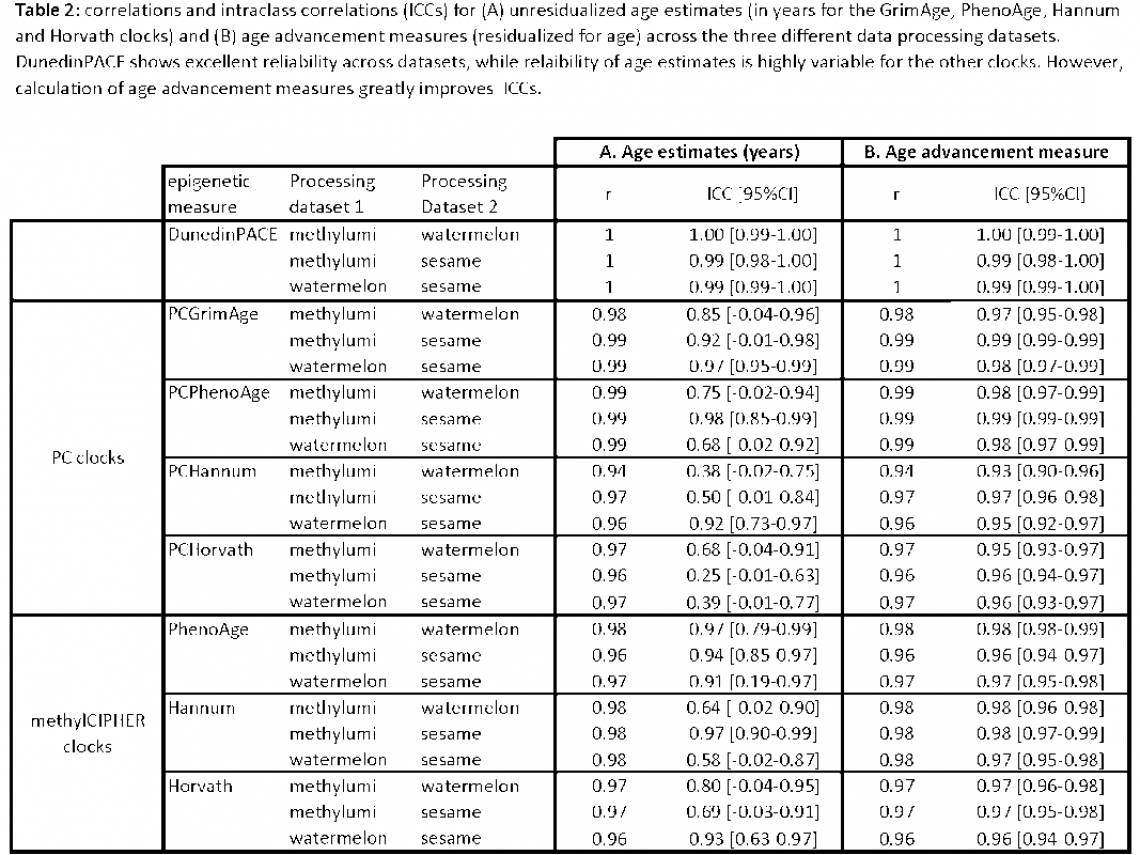
Table 1 shows the descriptive statistics and Table 2 the correlation and ICC(2,1) for (A) unresidualized age estimates (in years for the GrimAge, PhenoAge, Hannum and Horvath clocks) and (B) age advancement measures (residualized for age). These comparisons show the effect on estimates of epigenetic aging of using data processed using different pipelines.
The DunedinPACE versions differ least across the three different processing datasets; median DunedinPACE values in each of the three datasets are between 0.32% and 0.64% of the averaged median across all three datasets (i.e. average of the median DunedinPACE values in the methylumi, watemelon and sesame EPIC V2 datasets). Additionally, ICC values for unresidualized DunedinPACE estimates are very similar to age-residualized versions, suggesting that data processing does not influence estimates of either.
Consistent with cross-beadchip comparisons, unresidualized age estimates for the other four clocks show much variation across the three different data processing datasets (see Table 2A). However, age residualization of the estimates (creating age advancement estimates) increases ICCs to almost 1 across the board. This suggests that data processing induced variance in age measures can be eliminated by using age advancement measures. Again, this observation would need to be validated in another age-varying dataset.
Conclusions and recommendations
- PC corrected and uncorrected versions of epigenetic clocks are not closely associated with one another even within beadchip platform and should not be considered interchangeable.
- PC corrected clocks show good reliability across EPIC V1 and EPIC V2 beadchips, whilst uncorrected versions do not. Going forward, it would be preferable to use PC corrected versions of these measures, especially if using data from different beadchips.
- Age advancement measures have higher reliability than unresidualized age estimates; Age advancement measures should be used in preference to unresidualized age measures going forward. However, a caveat is that these observations were made in the Dunedin study which has very little age variation; further investigations should be made in samples with larger chronological age ranges.