Overview

To date, brain imaging studies have been limited by the use of small samples that are not representative of the general population, as well as by challenges in successfully connecting brain imaging measures with real-world experiences and outcomes. The Dunedin Brian Imaging Study represents our effort to address these challenges by collecting structural and functional brain imaging measures in the 1000 most studied people in the world. Originally a study of child health, the Dunedin Study has become best known for studying connections between childhood experience and adult health. Now with the help of funding by the US National Institute of Aging, it is becoming a study of aging.
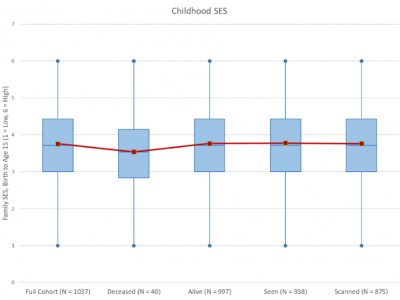
Members of the Dunedin Study include 1,037 people (91% of eligible births; 52% male) born between April 1972 and March 1973 in Dunedin, New Zealand (NZ). The cohort represents the full range of socioeconomic status (SES) in the general population of NZ’s South Island and matches the NZ National Health and Nutrition Survey on key adult health indicators (e.g., body mass index, smoking, GP visits) and the NZ Census of citizens of the same age on educational attainment. The cohort is primarily white (93%), which matches the demographics of the South Island. Assessments were carried out at birth and ages 3, 5, 7, 9, 11, 13, 15, 18, 21, 26, 32, 38, and most recently (completed April 2019) 45 years, when 94% (N = 938) of the 997 Study members still alive took part. Of these Study members, 875 (93% of age-45 participants), who were representative of the original cohort (see figure), completed brain imaging, which started in August 2016 and finished in April 2019.
Attrition Analysis. No significant differences in childhood IQ or SES were found between the full cohort, those still alive, those seen at Phase 45 or those scanned at Phase 45. Those who were deceased by the Phase 45 data collection had significantly lower childhood IQ’s than those who were still alive (t = 2.09, p = 0.04), but there were no differences in SES.